Friday 18 March 2016

Profiling Sitecore CMS

Sitecore CMS fetches information/items from underlying database, and caches it locally to speed up further reads, thus the overall system performance depends on:
  1. Database Performance
  2. Sitecore Cache Sizes
  3. CPU power ( how fast can processor find data in caches )
  4. The volume of data processed by target operation
In this chapter we`ll take a look on needed steps to find the cause of CMS slowness in the particular case.

Scenario

Lets` take a look on the scenario 'Workbox' application loading is slow.
Content editors complain that it takes a few years to open a Workbox. Since their life is too short, they cannot wait for that long =\
We are going to profile .NET Sitecore code to find which code takes too much of Content Editors life.

Action plan

This are general steops we are going to do:
  • Configure DotTrace Performance Profiler Tracing Session
  • Configure a data collector set in performance monitor 
  • Capture a full memory dump file of the Sitecore process before the test ( via Task Manager )
  • Start data collector set captuing & DotTrace Profile
  • Reproduce an issue ( Opening workbox )
  • Get Snapshot'n'Wait
  • Stop recording performance counters
  • Capture a full memory dump file of the Sitecore process after the test

Configuring DotTrace Profiler

Lets select 'Local -> IIS -> Tracing mode' in the demo.

DotTrace configuration

Important

  1. 'Start immediately' MUST be UNCHECKED.
  2. The shorter profile capturing session is, the less noise from other Sitecore activities would be captured -> the more accurate data we get
  3. A same scenario is to be captured at least 2 times in a different profiles :
    1. First call would hit 'cold' caches without data so it is expected to be quite slow =\
    2. Second call would hit caches with needed data, and is expected to be faster

Configure a data collector set

Extended counter list
The general steps to create a data collector set manually can be found in 'Create a Data Collector Set Manually' article.

We are about to select following counters:
  • Processor Information (_Total) \ Processor Time - see the overall CPU load by all processes on the target machine
  • Process(w3wp):
    • % Processor Time - how much CPU is used by Sitecore Process
    • Virtual Bytes 
    • Thread Count
    • % User Time
Those are main ones for now, however you can select more counters for better vision ( as per image)

Preparing for a test

Login to Sitecore Shell using test user. When user is logged in to Sitecore, capture a full memory snapshot of w3wp.exe process. We will later use it to :
  • Measure initial Sitecore Cache Size state
  • Find runing/scheduled Sitecore Jobs
  • Find most CPU-consuming threads
  • Objects by type distribution 

Starting profiling


The video shows exact steps needed:


Things to remember

  • It is important to start profiling immediately before reproducing an issue
  • Stop profiling immediately after the reproduction
  • A same scenario is to be profiled at least 2 times ( with cold/empty and filled caches )

Finishing test

After the testing session is over, lets collect more data:
  1. Another full memory dump file. It will be used later to compare with base one
  2. Following details via Sitecore Support Package Generator:
    1. Sitecore logs that cover the session
    2. Sitecore configuration files
    3. .NET framework files — required for working with process memory dumps
    4. Machine's hardware configuration
    5. Windows event logs

Results

The workbox opened in ~15 seconds, whereas a vast majority of time spend for resolving item security:
High number of operations is detected

The security resolution for a single item takes less than 3 ms, whereas overall amount of time is caused by huge number of security resolutions.

What can be done

Improving server hardware

  • Data collector set shows that memory usage is low, and does not hit number of physical RAM installed, thus improving server RAM would not have desired affect
  • Improve CPU
    • Data collector does not show high CPU =\
    • Lets assume more powerful CPU can reduce operation time from 3 ms to 2.5, so instead of 15 seconds, we will get 12.5 seconds. This is not the affect we are looking for.
  • Give more processor time to a thread
    • We can try to reduce the number of threads in Sitecore App, however in this scenario the number of threads is low, and will unlikely bring the desired affect

Reducing the number of security resolutions

Since the timing per one security resolution looks low, we can focus on reducing number of security resolutions. A possible option would be to rewrite SQL query to return only first 100 items ordered by date in workflow.

In next chapters we will take a closer look on analyzing memory dump files, and checking the cache usage statistics & distribution of objects by type.

Monday 7 March 2016

Profiling item fetch database performance


Any schema-change decision must be driven by data/statistics analysis.
One needs to test same functionality before, and after implementing the suggested change to see the real outcome.

A SQL Server Profiler provides statistics on how much resources were spent to process the SQL query.

An analysis of the statistics would actually show if any improvements were introduced, and if it is worth implementing the change.

Test scenario

  1. Create database backup
  2. Rebuild SQL Indexes to ensure low fragmentation rates
  3. Use stock Sitecore Testing DB performance page to collect the baseline first
  4. Implement database schema changes
  5. Ensure that SQL indexes are in a healthy state
  6. Restart SQL, and Sitecore to clean all cache layers
  7. Use stock Sitecore Testing DB performance page to collect second profile

Configuring Profiler

The SQL Server Profiler is a super-powerful tool that allows to capture dozen of various metrics.
We`ll use only base ones ( CPU, Reads, Writes, and Duration) in this session, though.
  1. Start SQL Server Profiler application
  2. Select 'New Trace' ( CTRL+N hotkey )
  3. Open 'Event Selection' tab and apply filters as per screenshot
  4. Ensure SQL Indexes on Items, and Field-related tables are in a healthy state, and start the test
Profiler configuration
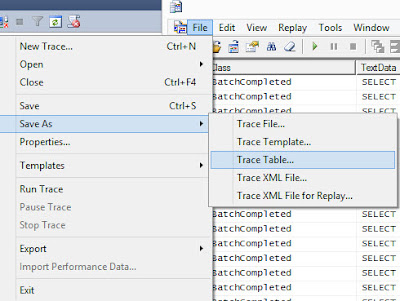
After the test is finished stop tracing, and save performance trace as a table:

Once data is saved, implement needed database changes, restart both Sitecore, and MSSQL Server.

Now we can repeat same set of operations, and record a new profile.

Comparing resulting profiles

A handly SQL query can be used to get aggregated statistics:

SELECT 'Optimized' as 'Where', 
      count(1) as TotalUp
      ,sum(op.[CPU]) as TotalCPU
      ,sum(op.[Reads]) as TotalReads
 FROM [master].[dbo].[big_Optimized] as op
 WHERE op.CPU IS NOT NULL

The results in my local environment are:
  • 35% less reads
  • 25 % less CPU
Please keep in mind that test results much depend on variety of data, and custom logic implemented in solution.

An end decision must be made after a few rounds of testing of following functionality:
  • Publishing
  • Live site navigation
  • Content Editing
The best performance optimization is to cache as much data inside Sitecore Caches as possible, thereby minimizing the number of requests to database.

We`ll cover Sitecore Caches configuration in next article

Sunday 6 March 2016

Speeding up item loading in Sitecore

Execution plan analysis

An execution plan for selecting an item by ID would have:
  1. IndexSeek for field-related tables, and further RID lookup ( or DAC_Clustered Key lookup).
  2. An ugly execution plan =\
  3. A long SQL statement ( at least 1000 characters )
  4. A sort operation (could be moved to Sitecore) costs ~10 %

Taking into account:
  1. Sitecore fetches items by ID only ( neither language, nor version is applied as a filter )
  2. Sitecore issues far more SQL read than write statements
  3. Relational database resources are typically more expensive in terms of scalability
There seems to be some room for improvements.

Possible improvements

  • Changing index types to clustered for Unversioned, Versioned, and Shared fields tables
    • NonClustered Index Seek with Key lookup inner join would be replaced with clustered index seek
    • Execution plan becomes much straightforward
  • Reworking items table indexes
    • Making ParentID index clustered to order data
    • OR making ID clustered index to enable fastest item fetch
  • Moving sort operation to Sitecore side
  • Using View instead of firing long ugly SQL all the time
Query plan after modifying indexes

Concerns

  • Inserts would take more time
    • The difference in single item save operation would not be noticeable for Content Editors, since a vast majority of total item save time is spend in 'item:saved' event handlers.
  • Publishing would be slower
    • Publish reads an item from both source and target databases first before making a decision whether to insert/update/remove item version. 
    • Having much faster reads could even improve the overall publishing speed.

Conclusion

A series of tests are required to get the understanding if it is worth to introduce those improvements in particular case.

In the next chapter we`ll take a look on basic technique how to perform SQL Profiling of Sitecore GetItem opearition.

How does Sitecore read item data ?

Where is content stored ?

All the item content/data is stored inside Shared, Unversioned, and Versioned field tables depending on field sharing type.
Items table has metadata about an item (IDnameparentIDtemplate).
Sitecore unions item metadata with actual fields content to construct an item instance.

How an item is read ?

'Sitecore.Data.SqlServer.SqlServerDataProvider.LoadItemDefinitions' method is responsible fetching data.
It raises a SQL query that unions aforementioned tables by configurable ItemID condition:
Item-related tables
SELECT [ItemId], [Order], [Version], [Language], [Name], [Value], [FieldId], [MasterID], [ParentID]
FROM (
SELECT [Id] as [ItemId], 0 as [Order], 0 as [Version], '' as [Language], [Name], '' as [Value], [TemplateID] as [FieldId], [MasterID], [ParentID]   FROM [Items] {A}
UNION ALL
SELECT [ParentId] as [ItemId], 1 as [Order], 0 as [Version], '' as [Language], NULL as [Name], '', NULL, NULL, [Id]   FROM [Items] {B} 
UNION ALL
SELECT [ItemId], 2 as [Order], 0 AS [Version], '' as [Language], NULL as [Name], [Value], [FieldId], NULL, NULL   FROM [SharedFields] {C}
UNION ALL
SELECT [ItemId], 2 as [Order], 0 AS [Version],       [Language], NULL as [Name], [Value], [FieldId], NULL, NULL   FROM [UnversionedFields] {C}
UNION ALL
SELECT [ItemId], 2 as [Order],      [Version],       [Language], NULL as [Name], [Value], [FieldId], NULL, NULL FROM [VersionedFields] {C})
as temp
WHERE [ItemId] IN (ItemID condition {D} ) ORDER BY [ItemId], [Order] ASC, [Language] DESC, [Version] DESC

Description

Black part {D} sets a condition to fetch items.
Examples:

  • ItemID = GUID in case single item fetch
  • ParentID=GUID in case loading item children
  • TemplateID in GUIDs in case prefetching items by template on CMS start
Red statement {A} selects data about currently read item

Yellow part {B} reads child IDs for the item
Blue part {C} gets item fields itself
Green part orders read rows by itemID, and orders them by Order column:

Rows order

Notes

  1. A whole item is read at once ( all versions in all languages ) from database when requesting one item version. It is highly NOT recommended to have many item versions in database ( Details in 6.2.3 chapter of CMS Performance Tuning Guide )
  2. Children IDs are read during item fetch as well
  3. The Sitecore performance is much determined by performance of the SQL query
In the next chapter we will take a closer look on how to improve the performance of the query.

Friday 5 February 2016

Sitecore Configuration Best Practices

What is Sitecore configuration ? How does it work ?

Sitecore CMS platform extensibility is mainly provided by a large set of configuration (providers, event subscribers, index definitions, settings and etc.).

Sitecore running configuration is read from web.config and combined with configuration files ( *.config) from '\App_Config\' folder.

Building resulting Sitecore configuration


The configuration is built via following steps:

  1. Read 'web.config' file
  2. Process 'App_config' folder nested configs & folders
  3. Process 'Include' folder configs in alphabetical order
  4. Process ''Include' folder nested folders content in alphabetical order
Building resulting configuration

Example

  1. web.config defines <setting name="CustomSetting" value="web.config value"/>
  2. AA.config patches <setting name="CustomSetting" set:value="AA"/>
  3. AB.config patches <setting name="CustomSetting" set:value="AB"/>
When order matters
Resulting value is taken from last alphabetical patch AB.config:

 <setting name="CustomSetting" value="AB" patch:source="AB.config" />

Summarize

  • Alphabetical order MATTERS-> Sitecore.A.config would be applied before Sitecore.B.config
  • If you want a config to be applied 100500%, put it into last alphabetical folder with last alphabetical name (f.e. 'zzz' folder with 'zzz.config' name)

Using resulting configuration inside Sitecore CMS 

Why ?

Aggregated configuration is used to:
  1. Create a lot of objects via reflection (f.e. Sitecore.Configuration.Factory.CreateObject API)
  2. Set cache sizes
  3. Construct pipelines, indexes
  4. Read setting values (f.e. Sitecore.Configuration.Settings.GetSetting("key","defaultValue")
  5. Process Sitecore Events & subscriptions

How to use configuration in code ? 

There are 2 main classes that encapsulate configuration-related logic:
  • Sitecore.Configuration.Factory static class allows to get config sections, create objects from config nodes
  • Sitecore.Configuration.Settings static class allows to get value of setting defined inside configuration with a fallback to default value
    • Meaning if value is not defined in resulting configuration, a fallback one would be taken (f.e. Settings.GetSetting("NotDefinedSetting", "DefaultValue") )
    • One can easily add custom setting (key-value pair) under sitecore/configuration/settings node, and value would be available via aforementioned API. 

Example

Configuration patch

<?xml version="1.0" encoding="utf-8"?>
<configuration xmlns:set="http://www.sitecore.net/xmlconfig/set/">
  <sitecore>
   <settings>
    <setting name="CustomSetting" value="CustomValue"/>
   </settings>
  </sitecore>
</configuration>

Reading value from patch

Following API is to be used in order to get value in runtime:

string value = Sitecore.Configuration.Settings.GetSetting("CustomSetting", "DefaultValue")

There are other methods in the Sitecore.Configuration.Settings class that should be mentioned:
Hidden setting (not in stock web.config) with default value 'True'
  • GetBoolSetting
  • GetIntSetting
  • GetTimeSpanSetting
  • GetLongSetting

Fetching whole configuration at once

Resulting XML configuration from running Sitecore can be received via :
  • 'Sitecore.Configuration.Factory.GetConfiguration()' API
  • Requesting '[hostname]\sitecore\admin\showconfig.aspx' page
The resulting document would have only '<Sitecore>' section inside, and would NOT have native ASP.NET sections =\

Build resulting configuration WITHOUT running Sitecore CMS

To ensure that Sitecore would pick your configuration changes correctly, you can use standalone application that emulates Sitecore config building - > Sitecore ConfigBuilder application.

It would use same logic as Sitecore CMS, and produce exactly same resulting configuration.

Why ? When ?


  1. Every config change provokes CMS restart. It could introduce additional time costs during patch tuning
  2. Stock 'showconfig' skips ASP.NET <system.web> and <system.WebServer> sections, whereas ConfigBuilder includes sections.
  3. Sitecore CMS may not start due to problems with configuration ( type not found, or node is missing ), and you will not be able to see 'faulting' configuration =\
  4. Config normalization ( removing XML comments, ordering ) simplifies further comparison


Developing patches

Include File Patching Facilities documentation highlights general rules on HowTo develop configuration patches (f.e. replace stock processor with a custom one, change setting value, remove event handler, and etc.)

Alexander Lebedenko has developed an awesome ConfigPatcher tool to automatize the config patching developing process. Though the UI is friendly, an image shows a set of needed steps to generate config patch file.

Config Patcher sample steps

Patching best practices


Never modify web.config file

It will save tons of your time during upgrading Sitecore solution. An upgrade procedure will likely come with a new version of web.config with extra nodes.

Sitecore Updater tool would detect changes in web.config and would NOT replace it with newer version.

You will have to manually copy modified nodes into web.config.
You could simplify an upgrade by using configuration patches instead.

Maintain baseline

Generate resulting configuration BEFORE applying patch and use it as base configuration version.

Generate a new resulting configuration AFTER applying configuration patch.

Use WinMerge tool to ensure that all needed changes are applied correctly.


Transfer patch to live Sitecore ONLY after verifying changes

Transfer patch to production environment only after verifying that patch changes configuration correctly.

Thursday 28 January 2016

Event Queues Part Duo

IMPROVING EVENT QUEUE PROCESSING SPEED

The number one problem is high number of records in Event Queue table. As we already know once the event is processed by all the Sitecore instances, it becomes useless and eligible to be removed.

If the number of records gets too high, cleanup procedure can fail with timeout exception, causing MSSQL to bend the knee.

Determine events by type statistics


Given SQL query shows 'hot' event types, and highlights priority optimizations:

SELECT MIN([Created]) AS Earliest,
MAX([Created]) AS latest,
DATEDIFF(day, MIN([Created]),MAX([Created])) as [Days between min and max],
COUNT(1) as TOTAL,
[EventType]
  FROM [EventQueue]
 GROUP BY [EventType]

The 'PropertyChangedRemoteEvent' usually is the winner for core database.
Lets see how can we reduce the received numbers.

Reducing number of events

Switching indexes property store to file system

Sitecore Content Search engine stores indexing metadata inside database property store.

Content Search needs a reliable storage to store metadata ( f.e. last indexed item ) to avoid re-indexing of already indexed data.

There is no need to share/sync the data between servers, thus no need to sync changes.

Using database properties could be costly in terms of performance in this case.
Sitecore Content Search may cause performance issues due of excessive updates of the EventQueue table gives a solution how to change property store.

The #420602 performance optimization  not to raise events in case code executed under EventDisabler) is addressed in 7.2 Update-5.

Logging to Sitecore interfaces with 'Remember Me' flag

In case 'Remember Me' flag is not selected during login to Sitecore interfaces, sliding expiration policy would be applied, and user ticket would be prolonged on every request.

Since Sitecore Client security mechanism should keep track/share information about simultaneously logged in users between servers, it has to use properties as well =\

Every ticket prolongation would update value inside properties table, thus provoke 'property changed' event.

A #443748 performance optimization has been introduced in CMS 7.2 Update 6, that noticeably reduces number of database property calls.

To sum up, always select 'Remember Me' flag.

Reducing number of publish operations

Every publish operation would produce 'publish:begin', 'publish:end' events, as well as publish 'languages' items.

Even though there are no actual content items to be published, a set of events would be produced, and system language items would be published.

If you are not going to add more languages to your solution, can comment out 'AddLanguagesToQueue' processor inside publish pipeline.

You can also consider to reducing the frequency of PublishingAgent executions.

Write less data into EventQueue

MSSQL would perform better if rows would have less data.

The #422510 optimization that allows to specify which changes are to be added into event data is available from CMS 7.2 Update 3.

In short - whenever item is saved, a list of modified fields with values is added into EventQueue.

If you update a field with 500 KB HTML text, it would be serialized and forwarded to database.

Needless to say that database server would appreciate if we could put less data.

I will create an article to describe in more details HowTo configure the configuration.

Aggressive cleanup policy

Stock 'CleanupEventQueue' agent was improved to perform cleanup in more aggressive way starting from 7.2 Update 4 (#392673).

For prior CMS versions once can use reworked stock cleanup task

How to pick optimal interval


The interval to keep should be more than longest running operation that uses EventQueue ( f.e. onPublishEnd indexing strategy )

F.e. Content indexes would be populated with freshly published data when publish:end is raised.

One should keep EventQueue rows produced by the publishing until indexing on all servers is over.

Wednesday 27 January 2016

How to share information between Sitecore Instances

What is the challenge ?

Lets say one wants to have a set of Sitecore instances that should modify/update same data(key-value pair) (f.e. number of people who have filled form, last task execution time, and so on).
A storage must be persistent, so application recycle would not cause any data lost.
Storage must handle high load, in-memory caching is required.

Can we achieve that without customization?
Can we just use OOB Sitecore functionality?

Technical sketch

  • It make sense to create a table (key-value) inside database.
  • Caching layer must respect data changes, as well as have defined limit
  • All interactions should be done via database provider, so one can handle changing database engine, and create tests if needed.


How To inside Sitecore ?

Sitecore CMS has Database Properties mechanism encapsulates everything aforesaid:

Sitecore.Configuration.Factory.GetDatabase("core").Properties["customKey"]=value

This mechanism is used internally f.e. to maintain Sitecore Client User tickets, publishing and indexing metadata.

Database Properties logic is inside 'Sitecore.Data.DataProviders.Sql.SqlDataProvider' class ( 'GetPropertyCore', ' SetPropertyCore', and  'RemovePropertyCore' methods ), so please feel free to check exact implementation via any reverse-engineering tool.


Implementation details

Each Sitecore database has 'Properties' table that represents key-value storage:

Interactions with database are done through DataProvider (defined in web.config under dataProviders node):

'Database property changed' event is added into EventQueue once property value is changed. As a result other Sitecore Instances eliminate modified property from cache, and would reload it from database directly on next call. Given SQL could be used to check what is written into EQ:
        •  SELECT * FROM [EventQueue] WHERE [InstanceType] LIKE '%PropertyChangedRemoteEvent%'
Property cache size is controlled by hidden 'Caching.DefaultPropertyCacheSize' setting, and equals to 500KB by default:

Summarize

Sitecore provides key-value storage synchronized across all instances out of the box.
The price to forward modification from one instance to other is an extra row in EventQueue.
Frequent properties modification could produce a large amount of EventQueue entries, so please use the feature wisely.